Key Steps of the Data Science Life Cycle Explained
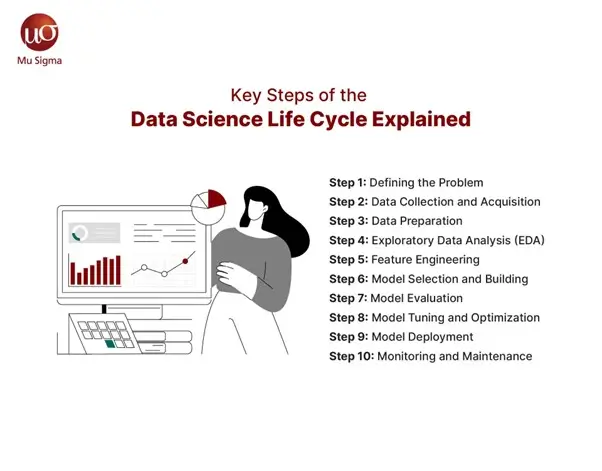
Have you ever wondered how data scientists turn raw data into actionable insights that drive business decisions? This transformation doesn’t happen by chance—it follows a systematic process known as the Data Science Life Cycle. Understanding this life cycle is crucial not just for data scientists but for anyone looking to leverage data to solve complex problems and make informed decisions. In this blog post, we break down the key steps of the data science life cycle into each of its phases in detail. This will give you great insight into how data science works.
1. Understanding the Data Science Life Cycle
The data science life cycle refers to the sequence of activities followed for the extraction of meaningful insights from data. This varies from understanding the business problem to the deployment of the model in a production environment. Each activity lays one brick on top of the last, thus providing a structured approach to solving data-driven problems.
2. Step 1: Defining the Problem
Every project involving data science starts with the problem to be solved. This means defining business objectives and determining how data can help meet those objectives.
a. Identifying Business Objectives
The key lies in figuring out what the business aims to achieve. Is it increasing sales, reducing churn, or perhaps optimizing operational efficiency? A clear definition of this objective aids in aligning the efforts of the data science teams with business objectives.
b. Framing the Data Problem
After formulating this business objective, the next step is to frame it as a data problem. That simply involves deciding what data is required, how it will be used, and what kind of analysis will be conducted to address the problem.
3. Step 2: Data Collection and Acquisition
Once a problem statement has been defined, the relevant data is collected. This is also one of the very important phases because data quality will determine the quality of the insights data.
a. Identifying Data Sources
Data can be accessed from several locations, such as databases, APIs, web scraping, or manual entry. Identifying high-quality sources matters because that decides whether the data collected represents some or not.
b. Data Gathering Techniques
Depending upon the source, different techniques are used to gather the data. For example, web scraping might be employed to fetch data from websites, whereas APIs might be utilized to get the data from applications. Therefore, the right technique should be selected for efficient collection.
4. Step 3: Data Preparation
Once data is collected, cleaning and transformation must be performed before it is analyzed. Often, this stage turns out to be the most resource-consuming part of the data science life cycle.
a. Data Cleaning
Data cleaning involves handling missing values, correcting inconsistencies, and removing duplicates. This step ensures the data is accurate and error-free, which is crucial for reliable analysis.
b. Data Transformation
Data transformation involves converting data into a format that can be easily analyzed. This could include normalizing data, encoding categorical variables, or scaling numerical values.
5. Step 4: Exploratory Data Analysis (EDA)
Exploratory Data Analysis is the summarization and visualization of the major characteristics of the data. It helps to better sense the data and identify trends or anomalies.
a. Visualizing Data
Visualization tools include histograms, scatter plots, and box plots, which are used to visualize the distribution. This will enable the identification of trends, correlations, and outliers.
b. Statistical Analysis
Most relationships between variables in the dataset can be understood by applying statistical methods such as correlation analysis, hypothesis testing, and regression analysis.
6. Step 5: Feature Engineering
Feature engineering is developing new features or even changing existing ones for better performance of machine learning models.
a. Creating New Features
One way to create new features is by using existing information in the data. For example, date and time can be used as one feature to improve the time-series analysis.
b. Feature Selection
Feature selection is choosing the most relevant features for model training. This helps in reducing the complexity of the model and improves its performance.
7. Step 6: Model Selection and Building
In this step, the data scientist selects and trains an appropriate model using the prepared data. The model choice depends on the problem type—whether it’s classification, regression, or clustering.
a. Choosing the Right Model
There are various machine learning models, such as decision trees, random forests, and neural networks. The choice depends on the nature of the problem and the data available.
b. Model Training
Once the model is selected, it is trained on the dataset to learn the underlying patterns. This involves feeding the model with data and adjusting its parameters to minimize errors.
8. Step 7: Model Evaluation
After training the model, it is essential to evaluate its performance to ensure that it meets the business objectives.
a. Performance Metrics
Metrics such as accuracy, precision, recall, and F1-score evaluate the model’s performance. For regression problems, metrics like Mean Squared Error (MSE) and R-squared are commonly used.
b. Cross-Validation
Cross-validation techniques, such as k-fold cross-validation, are used to assess the model’s performance on different subsets of the data. This helps in understanding how well the model generalizes to unseen data.
9. Step 8: Model Tuning and Optimization
Once the model is evaluated, it may need to be fine-tuned to improve its performance. This step involves adjusting model parameters and trying different configurations.
a. Hyperparameter Tuning
Hyperparameters are parameters that govern the training process of a model. Techniques like Grid Search and Random Search are used to find the optimal set of hyperparameters.
b. Model Optimization
Optimization techniques like Stochastic Gradient Descent (SGD) minimize errors and improve the model’s accuracy.
10. Step 9: Model Deployment
After the model has been fine-tuned and optimized, it is ready to be deployed in a production environment where it can be used to make predictions on new data.
a. Choosing the Deployment Environment
The deployment environment could be a cloud platform, an on-premise server, or even a mobile device. The choice depends on the application and the computational requirements of the model.
b. Integrating with Existing Systems
The deployed model needs to be integrated with existing systems and applications. This involves creating APIs or using platforms like TensorFlow Serving to make the model accessible for real-time predictions.
11. Step 10: Monitoring and Maintenance
Model deployment is not the end of the data science life cycle. Continuous monitoring is necessary to ensure that the model performs well over time.
a. Performance Monitoring
The model’s performance should be monitored regularly to detect any accuracy degradation or error rate. Tools like dashboards and automated alerts can be used for this purpose.
b. Model Retraining
As new data becomes available, the model may need to be retrained to maintain accuracy. This is especially important for dynamic environments where data patterns change frequently.
Final Words
Someone involved with data-driven decision-making needs to be aware of the overall processes involved in the data science life cycle. By following a structured process, data scientists ensure their projects are effective, relevant, and aligned with business goals. The process plays a critical role in a data science project, from defining the problem to preparing the data, building the models, and deploying and maintaining them.


